All posts by msalmani

AGU 2024 Fall Meeting Participation

The lab members will be participating in the AGU 2024 Fall Meeting in Washington, D.C. Here are the details of their presentations:

1. GC13W-04
Title: Bringing our changing Earth into a clear focus: how NASA’s laser altimetry revolutionizes ice sheet science
Presenters: Beata M Csatho, Helen Amanda Fricker, Scott B Luthcke
Date: Monday, December 9, 2024
Time: 14:43 – 14:53
Location: Salon A (Convention Center)


2. C43D-0288
Title: Automated Mapping of Greenland Ice Sheet Trimlines Using Sentinel-2 Imagery
Presenters: Mohammad Salmani, Jason P Briner, Beata M Csatho, Ana Carolina Moraes Luzardi, Sophie Nowicki, Ivan Parmuzin
Date: Thursday, December 12, 2024
Time: 13:40 – 17:30
Location: Hall B-C (Poster Hall) (Convention Center)


3. C33A-0409
Title: Greenland Mass Balance from Laser Altimetry between 1995 and 2020
Presenters: Hui Gao, Beata M Csatho, Michael J Croteau, Anton F Schenk, Nicole Schlegel, Brooke Medley, Max Brils, Brice Noel, Michiel R van den Broeke, Surendra Adhikari, Bryant D Loomis, Ivan Parmuzin, Kristin Poinar, Denis Felikson
Date: Wednesday, December 11, 2024
Time: 13:40 – 17:30
Location: Hall B-C (Poster Hall) (Convention Center)

Mass Balance and Velocity Data for Greenland’s Ice Sheets at High Elevations

Greenland Mass Balance

Goal

Estimation of mass balance of the Greenland Ice Sheet at higher elevations by using a mass budget method

Procedure & Methodology

Mass balance was computed as the difference between the estimated annual total snow accumulation and ice discharge

Outgoing flux is estimated from ice sheet velocity and ice thickness measured around the central part of the Greenland Ice Sheet

  • Ice velocity and thickness measurements at 161 stations located 30 km apart, at 2000 m elevation that circumnavigates Greenland
  • Stations are numbered counter-clockwise starting in the northwest corner
  • Ice velocities were determined from repeat, differential carrier-phase GPS data collected in 1-2 years intervals between 1993 to 1997
  • Ice thickness was measured by using ice-penetrating radar

Annual snow accumulation is estimated from an observational analysis of ice core and pit data.

Results are presented as mass balance estimates in single gates:

  • Data from two adjacent stations were combined to form 161 single gate

Mass balance estimates at medium-sized regions:

  • Adjacent single gates were combined to form 130 medium gates each with a minimum area of 30,000 km2.
  • The gates were grouped by shifting one traverse station at a time.

Mass balance estimates at large regions:

  • The single gates were combined to form 12 large gates (A-L) with an average area of approximately 100,000 km2 each.
  • The maximum numbers of single gates were in gate D with 23 single gates, from station F069 to F096.
  • The minimum numbers of single gates were in gate C with 6 single gates, from station F096 to F101.

Results

  • Overall the ice sheets in Greenland are in balance within 10mm/yr; thickening and thinning in different regions.
  • In the northwest the ice sheet thinned 5 cm/yr, and thickened 2 cm/yr in the northeast.
  • In the southwest the ice sheet thickened 21 cm/yr, and thinned 30 cm/yr in the southeast

People

University at Buffalo

  • Dr. Beata Csatho – Point of Contact: E-Mail
  • Melissa Zelazny
  • Justin L. Rich
  • Taehun Yoon

EG&G Services

  • Robert Thomas

University of Kansas

  • Prasad Gogineni: Electrical Engineering & Computer Science. E-Mail

Publications

  • Thomas, R., T. Akins, B. Csatho, M. Fahnestock, P. Gogineni, C. Kim, and J. Sonntag. 2000. Mass balance of the Greenland Ice Sheet at high elevations. Science 289: 426-427.
  • Thomas, R., B. Csatho, C. Davis, C. Kim, W. Krabill, S. Manizade, J. McConnell and J. Sonntag. 2001. Mass balance of higher-elevation parts of the Greenland Ice Sheet. Journal of Geophysical Research – Atmosphere 106 (D24) (December): 33707-33716.
  • Thomas, R., B. Csatho, S. Gogineni, K. Jezek, and K. Kuivinen. 1998. Thickening of the western part of the Greenland Ice Sheet. Journal of Glaciology 44: 653-658.

Mass Balance and Velocity Data for Greenland’s Ice Sheets at High Elevations – Data

Interactive Map

This map shows the data for the large gates, single gates and GPS stations through a combination of interactive maps.

Data For Velocity

Data For Mass Balance

This data was presented in 2000 in the Science Journal, then recalculated and presented in the Journal of Geophysical Research in 2001

Spectral Radiometer Data for West Greenland

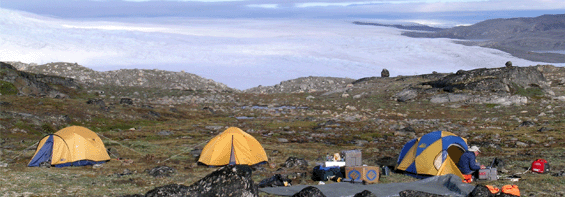
Field camp near Jakobshavn (in background). Photo by: Bea Csatho

Data Description

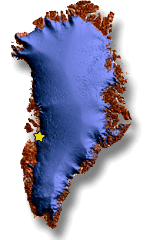
Data Collection Location in Greenland

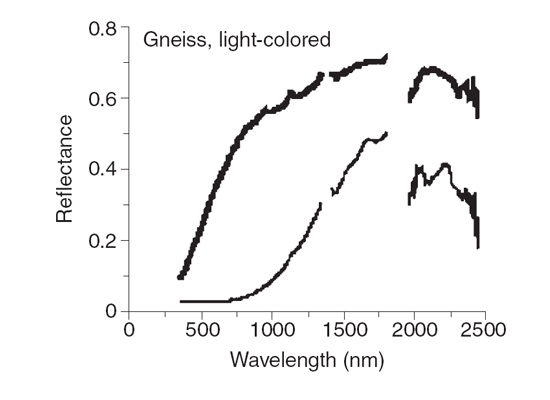
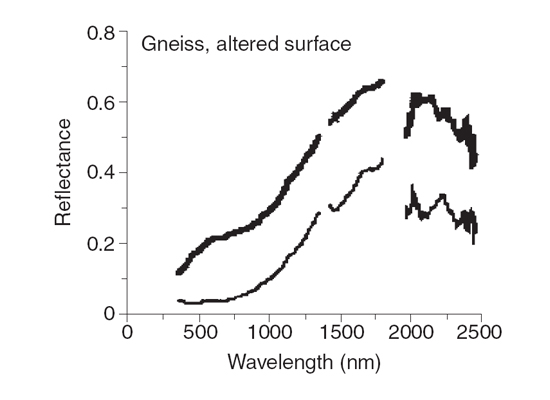
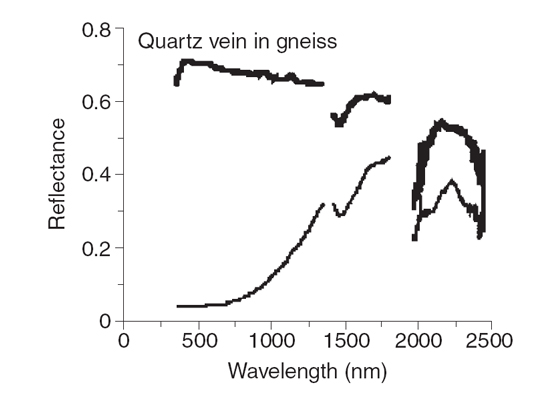
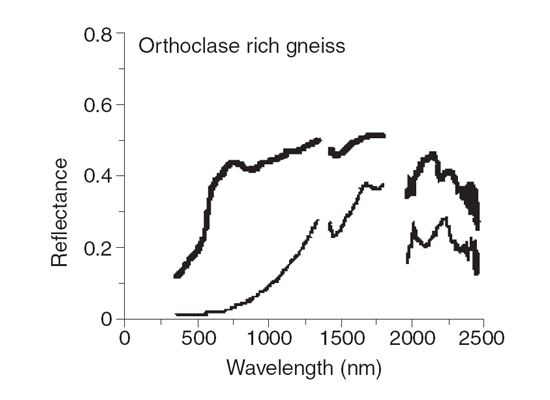
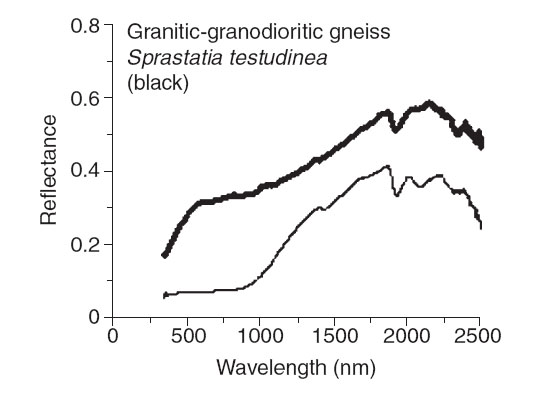
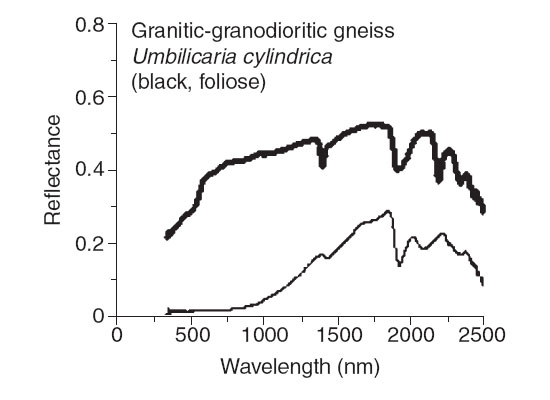
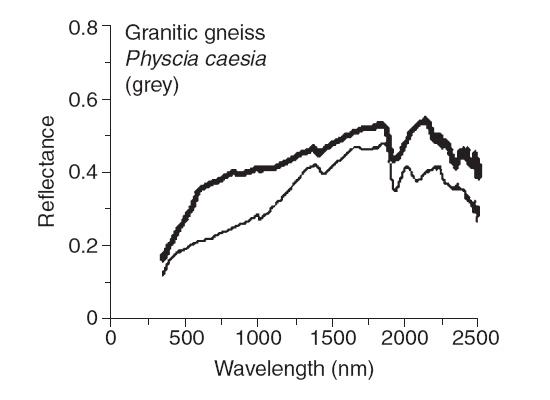
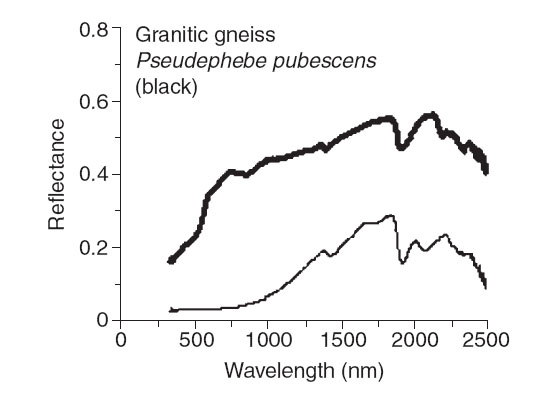
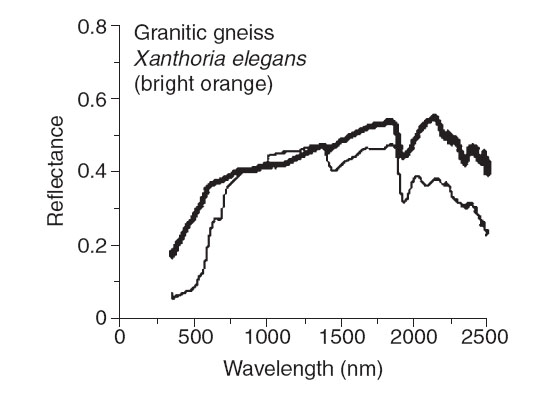
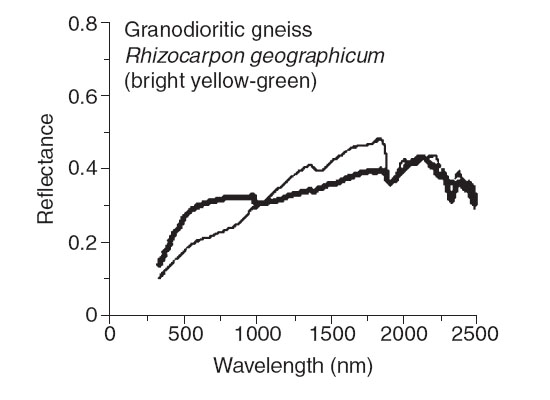
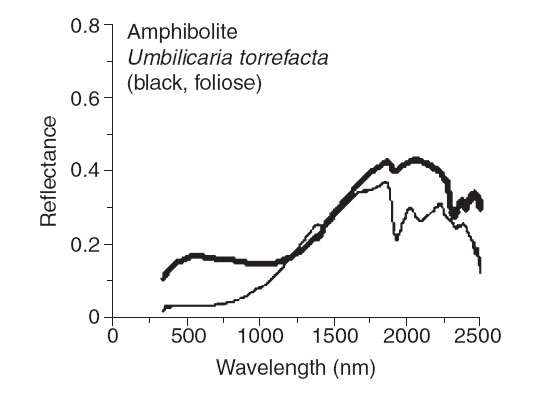
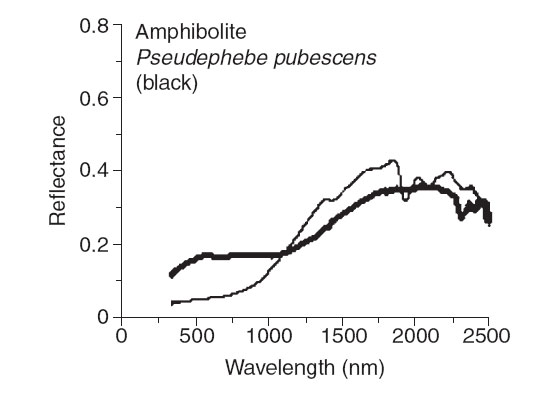
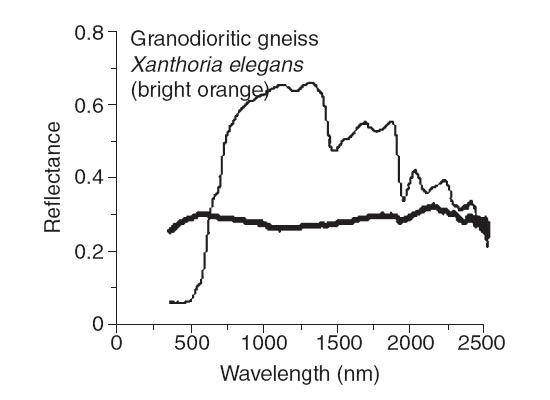
Field measurements of the effect of black crustose lichen on reflectance of various rock substrates. The heavy curves correspond to bare rock and the light curves to lichen on the same substrate. Gaps in the curves correspond to the atmospheric water vapor absorption bands, as explained in Vander Veen 2005.

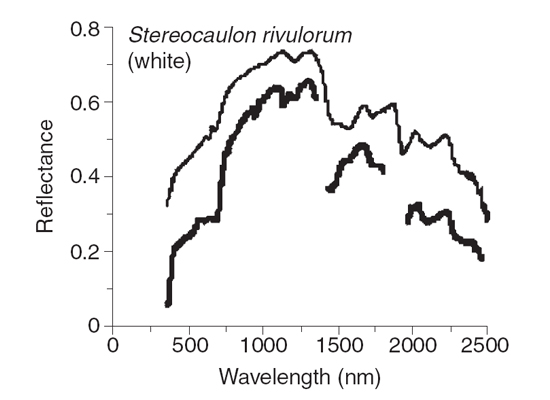
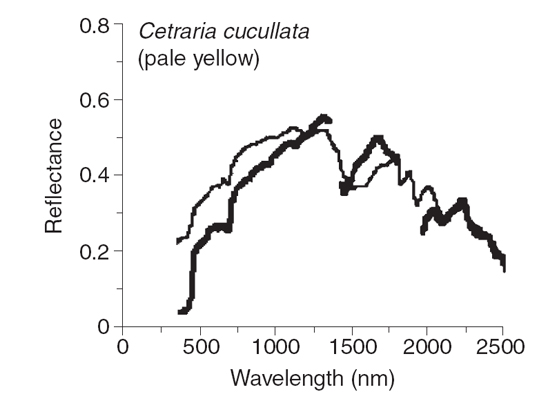
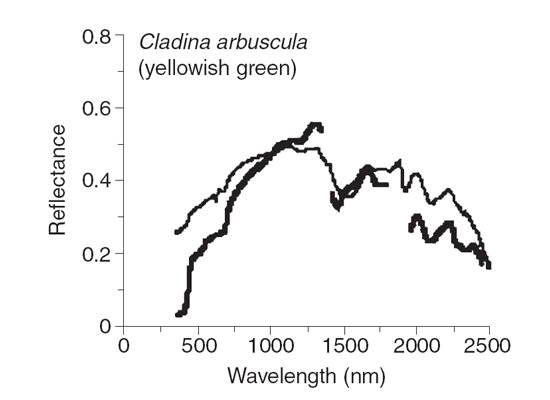
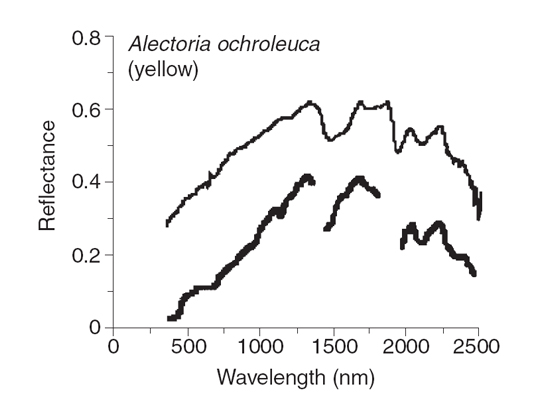
Reflectance spectra of various fructicose lichens as measured in the field (heavy curves) and in the laboratory (light curves) using the same samples.

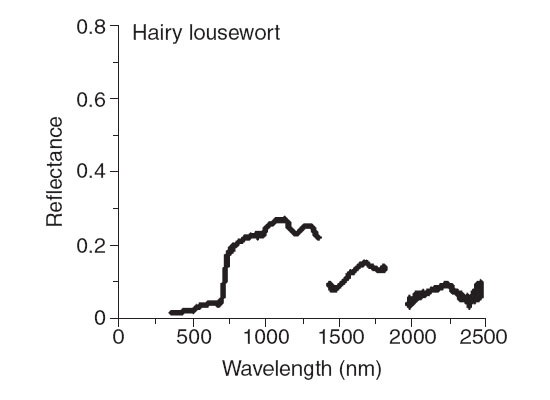
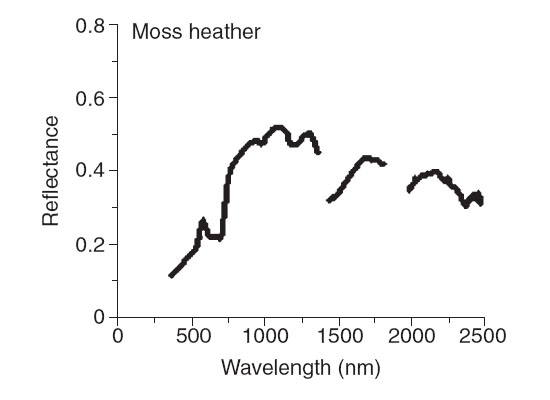
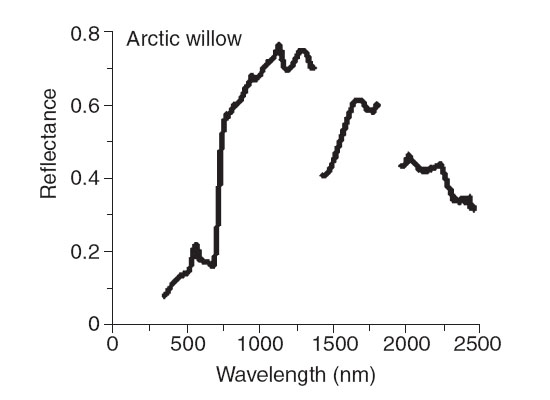
Reflectance spectra of typical west Greenland tundra vegetation, measured in the field.

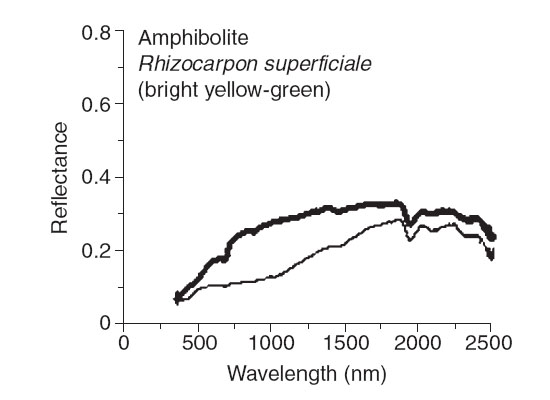
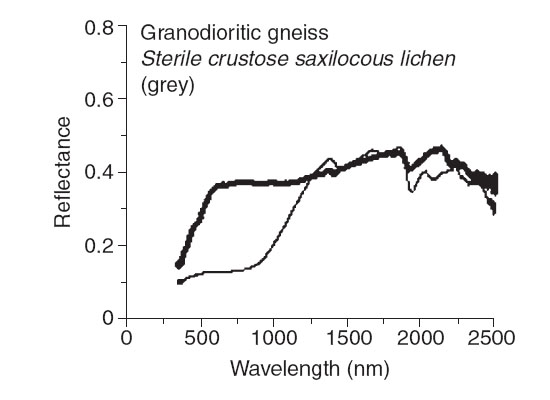
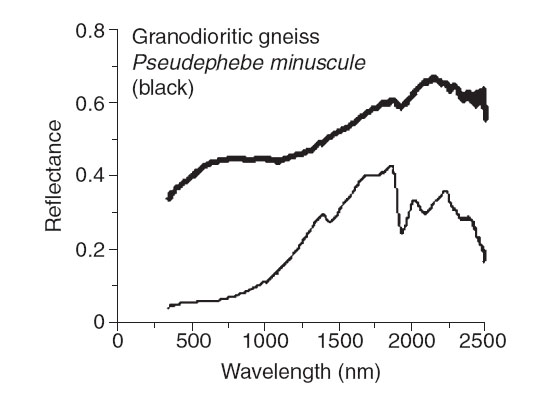
Effect of Crustose (unless otherwise noted) lichens on various rock substrates as measured in the laboratory using samples collected in west Greenland. Heavy curves refer to bare rock and light curves to lichen on the same rock sample.

Effect of Crustose (unless otherwise noted) lichens on various rock substrates as measured in the laboratory using samples collected in west Greenland. Heavy curves refer to bare rock and light curves to lichen on the same rock sample.

People

  • C. J. Van der Veen
  • Dr. Beata Csatho

Preferred Citation

Van der Veen, C. J. and Csatho, B., 2005. Spectral characteristics of Greenland lichens. Géographie physique et Quaternaire, 59: 63-73.


Data

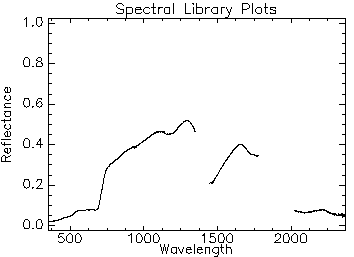
Spectral Library
ENVI 4.3 Spectral Library File (4.4 MB) – Download

Spectral Library with Descriptive File Names
ENVI 4.3 Spectral Library File (4.4 MB) – Download

Metadata
jpeg Files (86.9 MB) – Download

SUNY at Buffalo – GPS Test Points

Data Description

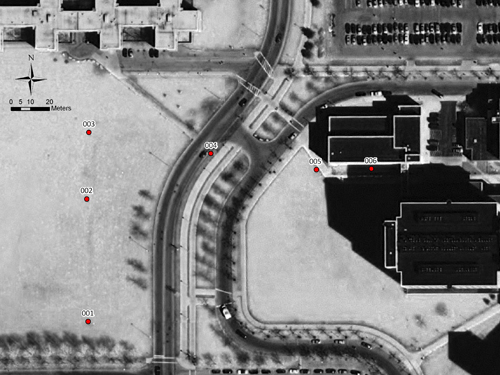
Differentially corrected GPS points collected near the Natural Science Complex, State University of New York at Buffalo, Buffalo, NY 14260-3050. Points were collected using a Trimble 5700 GPS unit and corrected to a Trimble 5700 serving as a base station nearby. The dataset was created to look at the results / accuracy of several GPS units by serving as a standard dataset to compare the individual GPS units.

Photos

Overview of the GPS points

Data

Control Points
Shapefile containing 6 corrected GPS points and base station coordinates (8.67 KB) – Download

Control Point Photos
JPEG photos of control point locations (2.22 MB) – Download

Spectral Radiometer Data for the North Slope, Alaska

Data Description

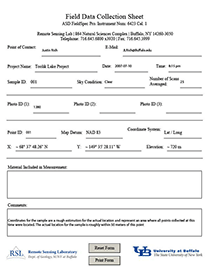
Spectral radiometer data was collected in three locations north of the Brooks Range in the area of Toolik and Galbraith Lakes, Alaska during July of 2007. Several surface cover materials were collected at each location using an ASD Field Spec Pro. and compiled into an ENVI spectral library file for use and distribution. Included in the files for download are:

  • ENVI spectral library file
  • Metadata for each sample collected

People

  • Justin L. Rich
  • Dr. Beata Csatho

Data Example

NorthSlope_Data
NorthSlope_Metadata

Preferred Citation

Rich, J. L. and Trochim, E. (2007) AMS Spectrometer data: North Slope Alaska. Instrument 6423, Cal. 1


Data

Spectral Library
ENVI 4.3 Spectral Library File (229 KB) – Download

Metadata
PDF and JPEG Files (37.3 MB)Download

Archived Workshop on Science Opportunities for a MultidisciplinaryLong-Range Aircraft for Antarctic Research

(From M. Studinger, LDEO)

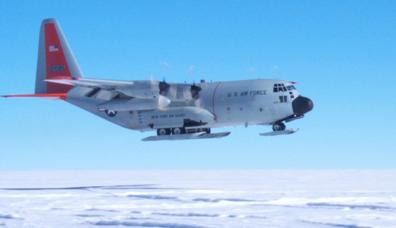
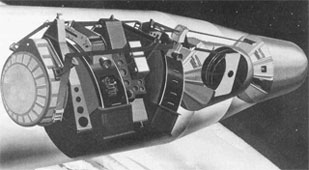
This 2004 workshop (Days Hotel, Herndon, VA) focused on a multidisciplinary, long-range aircraft for Antarctic research. Scientists from aerophysics, glaciology, atmospheric science, and oceanography explored science opportunities and instrumentation needs for such a platform. The NSF/NCAR C130Q served as a model for payload capacity, with discussions on modifying an existing LC-130 and potential international collaboration. This workshop aimed to develop a plan for this specialized aircraft to address unique Antarctic research challenges.

Investigation of the Permafrost Table through Multi-resolution Object-Oriented Fuzzy Analysis

This study examines the current surface conditions of a study area near Toolik Lake, Alaska, and seeks to differentiate the surficial geology and geomorphology, largely influenced by glacial activity, as well as the ecology of the region, in order to characterize the current state of the permafrost table. Using an object-oriented multi-scale segmentation approach, this study will utilize Definiens Professional, a remote sensing application that, among other things, allows for rapid reproduction of GIS-ready information (Definiens 2006), fuzzy analysis of data and integration of multiple data types within the same project. Working in conjunction with ENVI, it will allow for the construction of a model based on spectral properties of the surface materials and hopefully yield more accurate results than a pixel-based classification solely based on a training set.

Data for this thesis project will include Hyperion, EO-1, and Landsat images; as well as, various vector datasets including elevation and land cover.

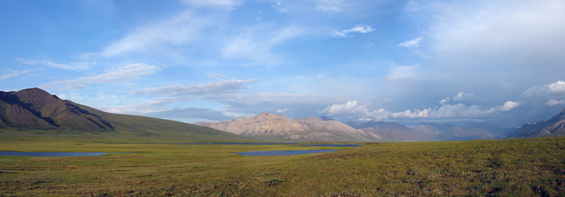
Looking South Toward Galbraith Lake. Photo: Justin Rich

DOWNLOADS

  • Spectral radiometer data for sites near Toolik and Galbraith Lakes, Alaska – Launch
  • Poster Presented (low-resolution version) during the 38th annual Arctic Workshop in Boulder, CO

Useful Links

  • Arctic Long-Term Ecological Research Site – Launch
  • Toolik Lake Field Station GIS – Launch
  • National Snow and Ice Data Center – Launch

REFERENCE

Definiens AG. (2006). Definiens Professional 5: User Guide v.5.0.6.2. Published by Definiens AG, Munchen, Germany.

Geological Controls of Ice Flow

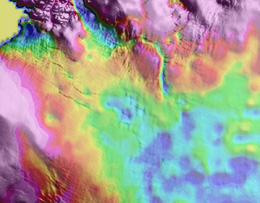
  • Mapping subglacial geology by using airborne geophysical measurements
  • Investigating the effect of subglacial geology on ice dynamics

Projects

  • Collaborative research: Science opportunities for a multidisciplinary long-range aircraft for Antarctic research. B. Csatho and D. Bromwich, NSF, 2004 – 2005.
  • Airborne geophysics and remote sensing applied to study Greenland ice dynamics. B. Csatho, NASA, 2001.
  • Architecture and evolution of a rift accommodation zone: remote sensing of the Transantarctic Mountains. T. Wilson, B. Csatho, NSF, 1997 – 2001.

Past Meetings

Selected Publications and Presentations

  • Leftwich, T. E., C. J. van der Veen, R. R. von Frese, B. Csatho, 2006. Subglacial topographic effects on the geothermal heat flux of the Greenland ice sheet, Eos Trans. AGU87(52), Fall meeting. Suppl., Abstract C41A-0319.
  • Csatho, B., C.J. van der Veen, R. von Frese, H. Rae Kim, J. Kiss, T. Leftwich and A. Braun, 2006. Subglacial control on glacier flow in northern Greenland. International Glaciological Society Symposium on Earth and Planetary Ice-Volcano Interactions, 19-23 June 2006, Reykjavik, Iceland. (pdf)
  • Braun, A., H-R. Kim, B. Csatho, R.R.B. von Frese, in review. Gravity-inferred crustal thickness of Greenland. Earth and Planetary Science Letters
  • Studinger, M., D. Bromwich, B. Csatho, R. Muench, T, Parish and J. Stith, 2005. Science opportunities for a long-range Antarctic Research Aircraft (LARA). EOS, 86(4), 39-40.

Historical Imagery

Utilizing historical imagery to extend the time line as far as possible

Projects

  • Reconstruction the history of Greenland outlet glaciers since the Little Ice Age. B. Csatho, T. Schenk and C.J. van der Veen, NASA, 2006 – 2007.

Selected Publications and Presentations

  • Yoon, T., T. Schenk, B. Csatho, 2006. Long-term change detection from historical photography, Eos Trans. AGU87(52), Fall Meet. Suppl., Abstract IN41A-0880. (pdf)
  • Thomas, R. H., W. Abdalati, T. Akins, B. Csatho, E. Frederick, P. Gogineni, W. Krabill, S. Manizade, and E. Rignot, 2000. Substantial thinning of a major east Greenland outlet glacier. Geophysical Research Letters27(9), 1291-1294.
  • Csatho, B. M., J. F. Bolzan, C. van der Veen, T. F. Schenk, and D-C. Lee, 1999. Surface velocities of a Greenland outlet glacier from high-resolution visible satellite imagery. Polar Geography23, 71-82. (pdf)

International Initiatives And Related Meetings