Jeremy Stock successfully defended his MS thesis, “Modeled Patterns of Crevassing Induced by Supraglacial Lake Drainage in Western Greenland”, and turned in a very nice dissertation this May. Congratulations, Jeremy!
Abstract:
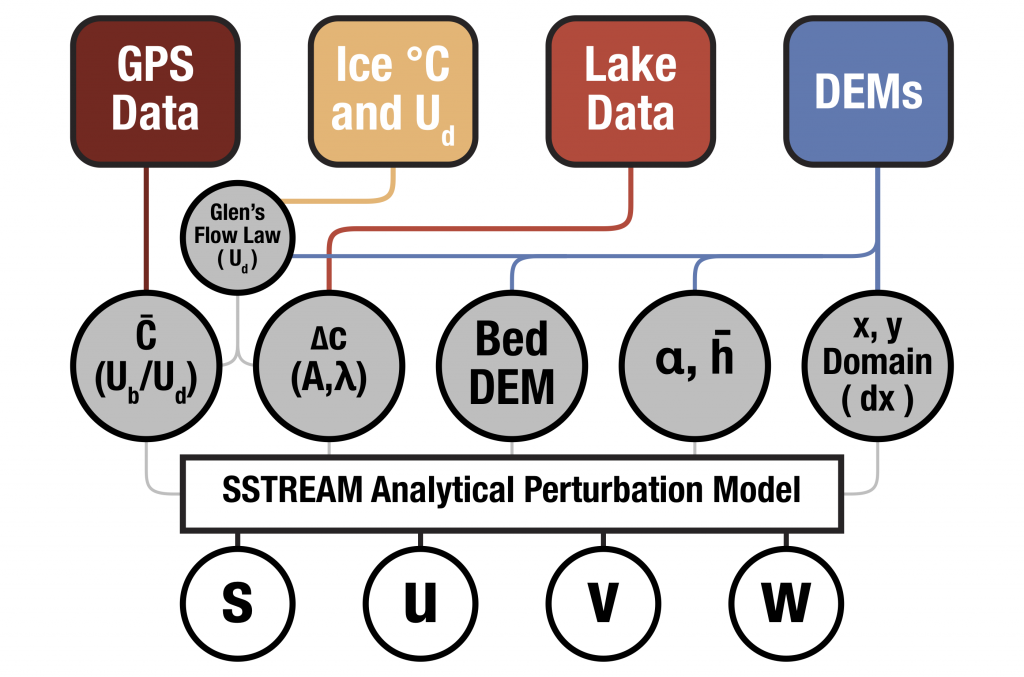
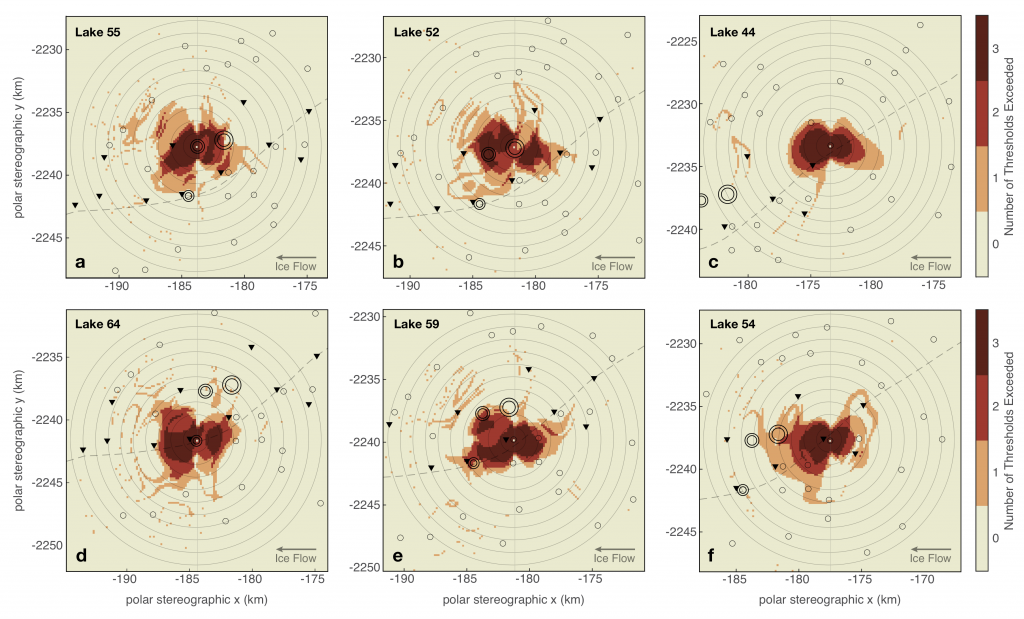
The Greenland Ice Sheet is expected to contribute substantially to global sea level rise over the next century in response to climate change. As increasing volumes of surface meltwater are delivered to the glacier bed via moulins during supraglacial lake drainage events, it has been hypothesized that new crevasses may form upflow, causing a cascade of lake drainages. This upflow expansion could alter ice sheet dynamics, leading to ice sheet instability and even greater sea level rise contributions. To investigate this hypothesis, we applied an analytical ice-flow model (Gudmundsson, 2008) to calculate surface strain rates and infer the pattern of crevassing induced by a modeled rapidly drained lake. We calibrate the model using data collected during a lake drainage event in the summer of 2011 in the Pakitsoq region of Western Greenland. The patterns and extent of crevassing we see in our model results are highly dependent on the bed topography, basal sliding ratio, dimensions of the slipperiness patch, and the seasonal timing of the drainage event. Our model results show evidence of considerable crevassing occurring within 3-5.5 km upstream of the modeled lake drainage, with crevassing enhanced by a factor of 5-6 within a 3 km radius of the rapidly drained lake. Because lakes in this area are spaced by roughly 2-4 km, our results support the hypothesis for cascading lake drainage. This research improves our understanding of how meltwater may affect ice sheet dynamics, which are a major factor in how much the Greenland Ice Sheet will contribute to sea level rise in the future.
G. H. Gudmundsson. Analytical solutions for the surface response to small amplitude perturbations in boundary data in the shallow-ice-stream approximation. The Cryosphere, 2(2):77–93, 2008. http://doi.org/10.5194/tc-2-77-2008
Modeled Patterns of Crevassing Induced by Supraglacial Lake Drainage in Western Greenland
A few figure excerpts: