Category Archives: Data

Mass Balance and Velocity Data for Greenland’s Ice Sheets at High Elevations

Greenland Mass Balance

Goal

Estimation of mass balance of the Greenland Ice Sheet at higher elevations by using a mass budget method

Procedure & Methodology

Mass balance was computed as the difference between the estimated annual total snow accumulation and ice discharge

Outgoing flux is estimated from ice sheet velocity and ice thickness measured around the central part of the Greenland Ice Sheet

  • Ice velocity and thickness measurements at 161 stations located 30 km apart, at 2000 m elevation that circumnavigates Greenland
  • Stations are numbered counter-clockwise starting in the northwest corner
  • Ice velocities were determined from repeat, differential carrier-phase GPS data collected in 1-2 years intervals between 1993 to 1997
  • Ice thickness was measured by using ice-penetrating radar

Annual snow accumulation is estimated from an observational analysis of ice core and pit data.

Results are presented as mass balance estimates in single gates:

  • Data from two adjacent stations were combined to form 161 single gate

Mass balance estimates at medium-sized regions:

  • Adjacent single gates were combined to form 130 medium gates each with a minimum area of 30,000 km2.
  • The gates were grouped by shifting one traverse station at a time.

Mass balance estimates at large regions:

  • The single gates were combined to form 12 large gates (A-L) with an average area of approximately 100,000 km2 each.
  • The maximum numbers of single gates were in gate D with 23 single gates, from station F069 to F096.
  • The minimum numbers of single gates were in gate C with 6 single gates, from station F096 to F101.

Results

  • Overall the ice sheets in Greenland are in balance within 10mm/yr; thickening and thinning in different regions.
  • In the northwest the ice sheet thinned 5 cm/yr, and thickened 2 cm/yr in the northeast.
  • In the southwest the ice sheet thickened 21 cm/yr, and thinned 30 cm/yr in the southeast

People

University at Buffalo

  • Dr. Beata Csatho – Point of Contact: E-Mail
  • Melissa Zelazny
  • Justin L. Rich
  • Taehun Yoon

EG&G Services

  • Robert Thomas

University of Kansas

  • Prasad Gogineni: Electrical Engineering & Computer Science. E-Mail

Publications

  • Thomas, R., T. Akins, B. Csatho, M. Fahnestock, P. Gogineni, C. Kim, and J. Sonntag. 2000. Mass balance of the Greenland Ice Sheet at high elevations. Science 289: 426-427.
  • Thomas, R., B. Csatho, C. Davis, C. Kim, W. Krabill, S. Manizade, J. McConnell and J. Sonntag. 2001. Mass balance of higher-elevation parts of the Greenland Ice Sheet. Journal of Geophysical Research – Atmosphere 106 (D24) (December): 33707-33716.
  • Thomas, R., B. Csatho, S. Gogineni, K. Jezek, and K. Kuivinen. 1998. Thickening of the western part of the Greenland Ice Sheet. Journal of Glaciology 44: 653-658.

Spectral Radiometer Data for West Greenland

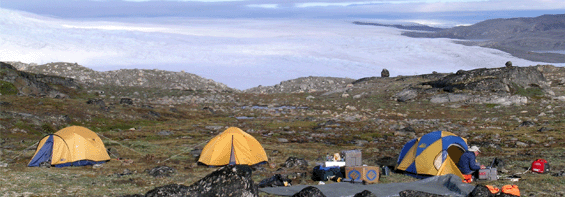
Field camp near Jakobshavn (in background). Photo by: Bea Csatho

Data Description

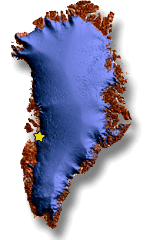
Data Collection Location in Greenland

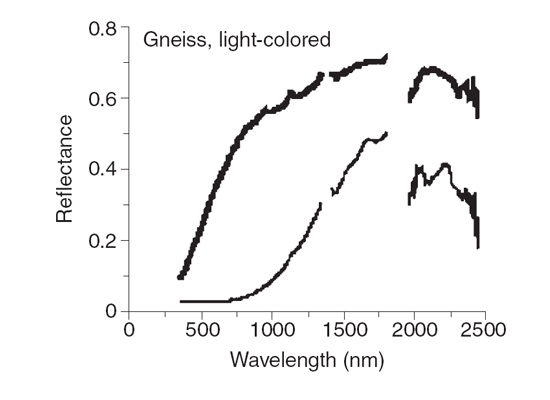
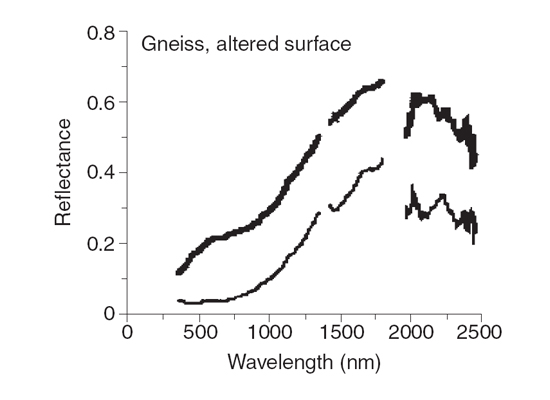
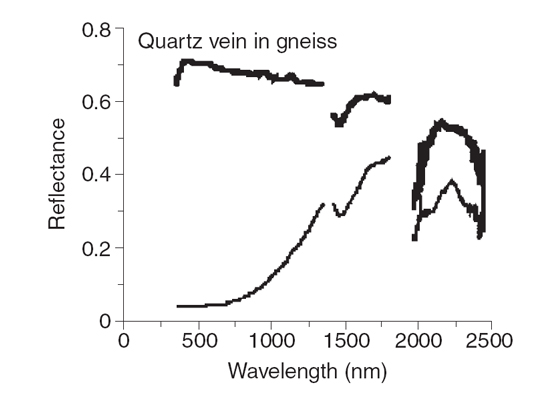
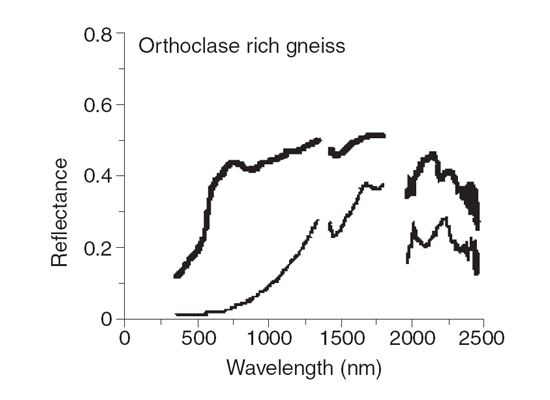
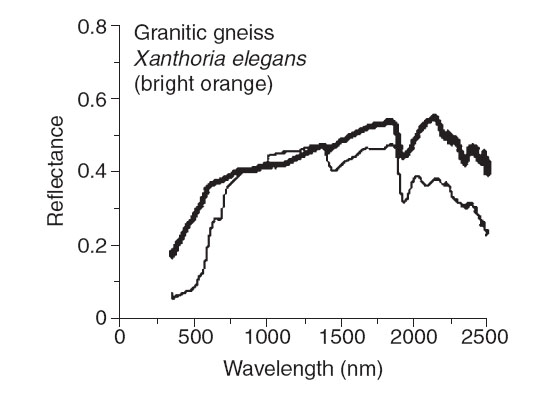
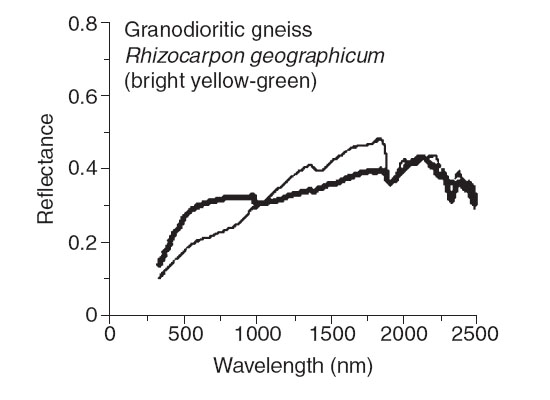
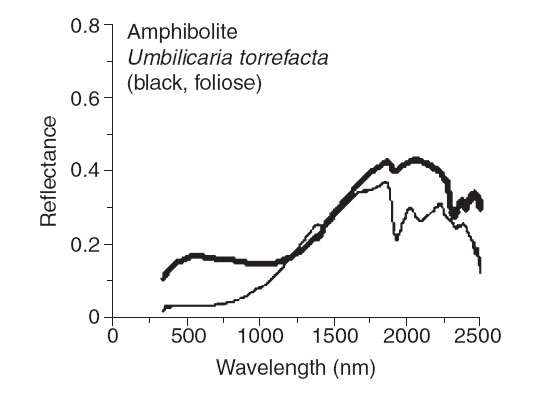
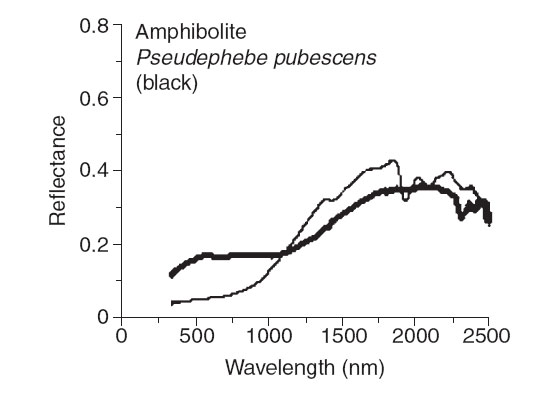
Field measurements of the effect of black crustose lichen on reflectance of various rock substrates. The heavy curves correspond to bare rock and the light curves to lichen on the same substrate. Gaps in the curves correspond to the atmospheric water vapor absorption bands, as explained in Vander Veen 2005.

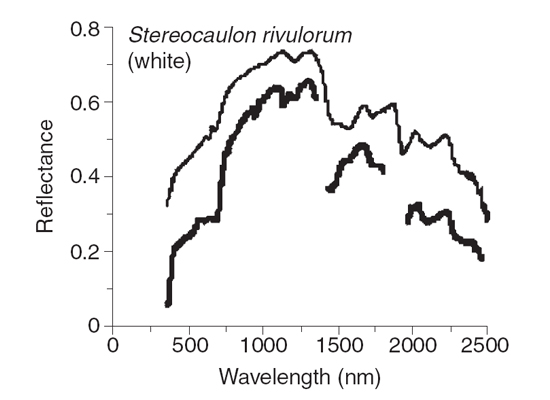
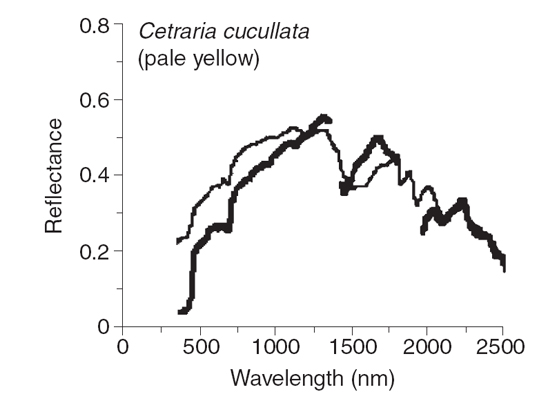
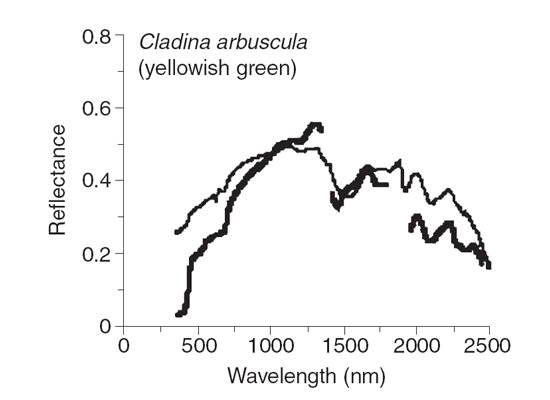
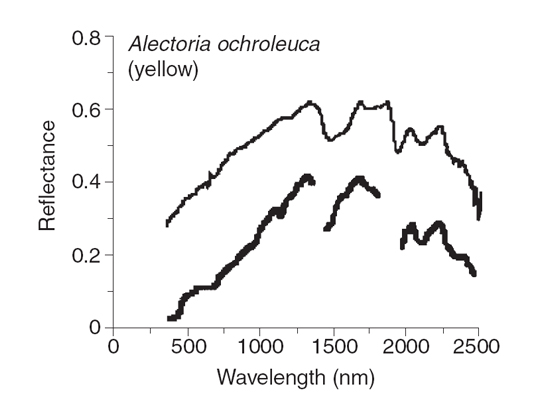
Reflectance spectra of various fructicose lichens as measured in the field (heavy curves) and in the laboratory (light curves) using the same samples.

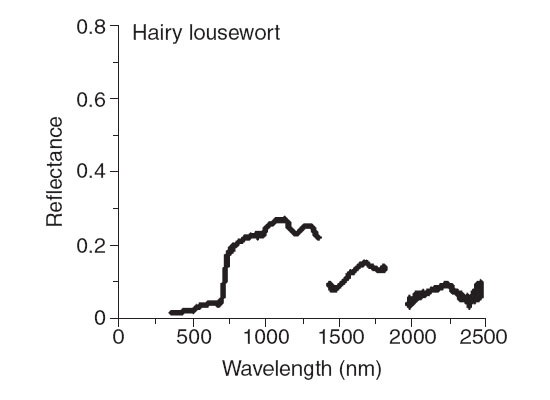
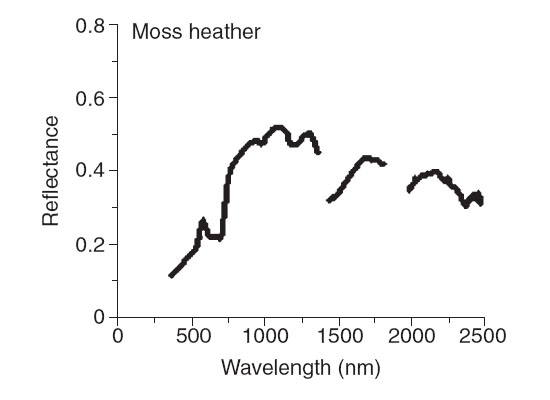
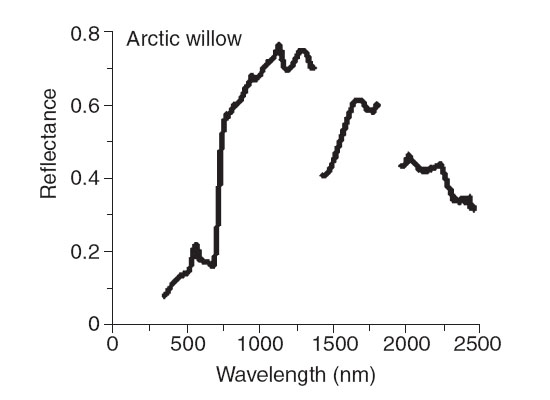
Reflectance spectra of typical west Greenland tundra vegetation, measured in the field.

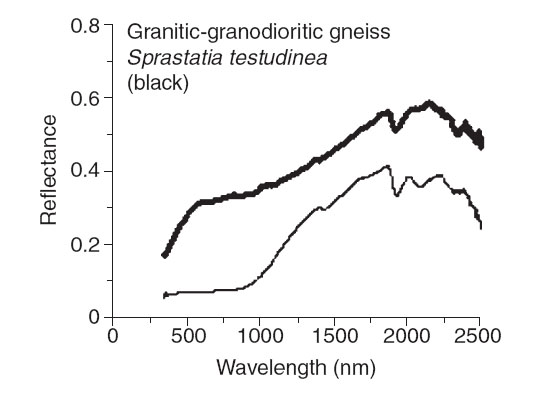
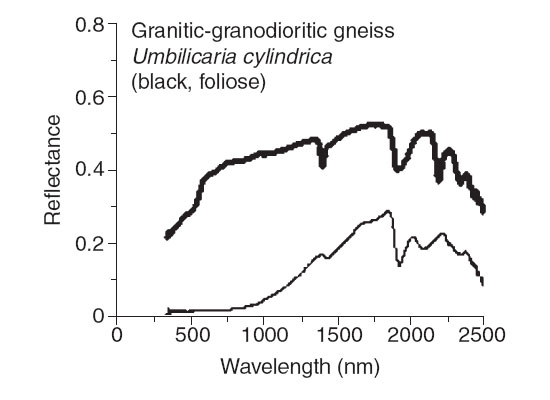
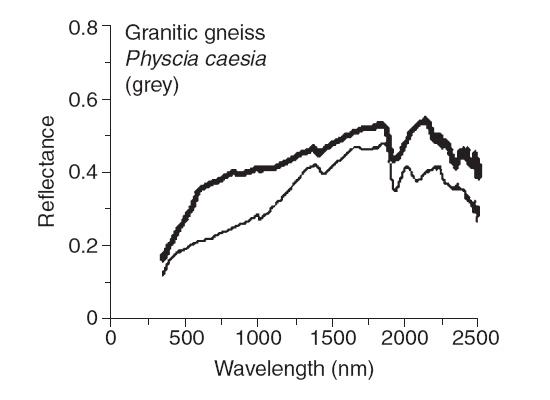
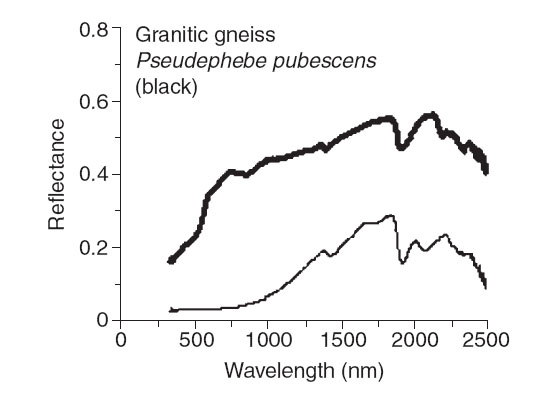
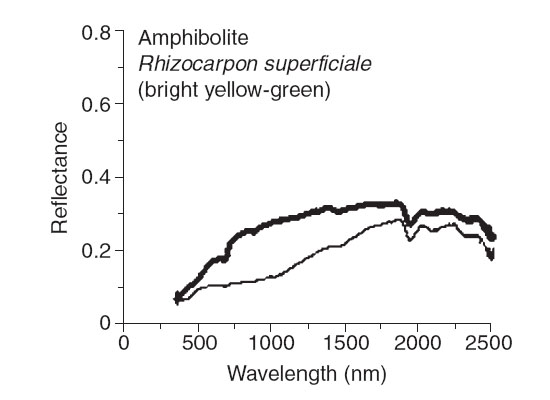
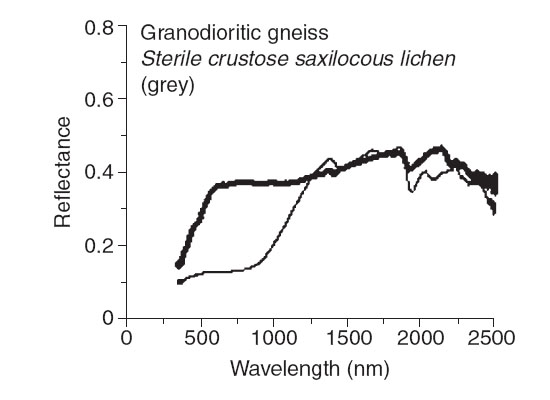
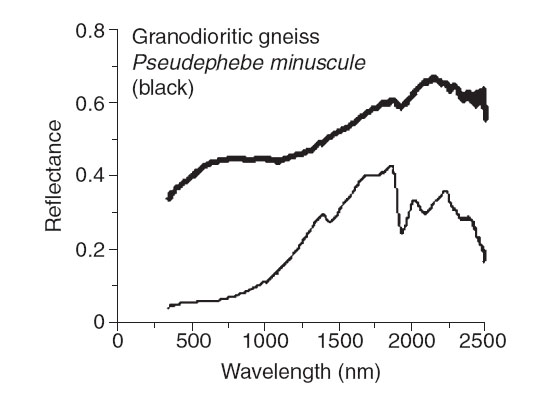
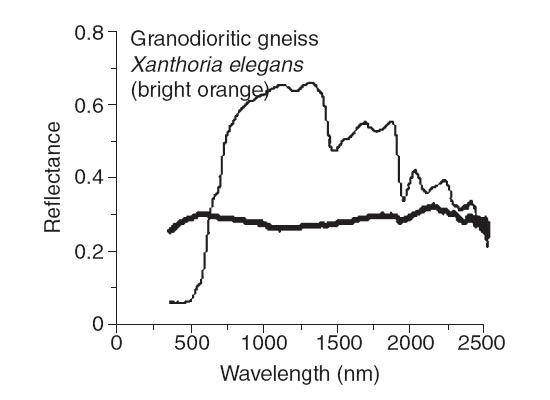
Effect of Crustose (unless otherwise noted) lichens on various rock substrates as measured in the laboratory using samples collected in west Greenland. Heavy curves refer to bare rock and light curves to lichen on the same rock sample.

Effect of Crustose (unless otherwise noted) lichens on various rock substrates as measured in the laboratory using samples collected in west Greenland. Heavy curves refer to bare rock and light curves to lichen on the same rock sample.

People

  • C. J. Van der Veen
  • Dr. Beata Csatho

Preferred Citation

Van der Veen, C. J. and Csatho, B., 2005. Spectral characteristics of Greenland lichens. Géographie physique et Quaternaire, 59: 63-73.


Data

Spectral Library
ENVI 4.3 Spectral Library File (4.4 MB) – Download

Spectral Library with Descriptive File Names
ENVI 4.3 Spectral Library File (4.4 MB) – Download

Metadata
jpeg Files (86.9 MB) – Download

SUNY at Buffalo – GPS Test Points

Data Description

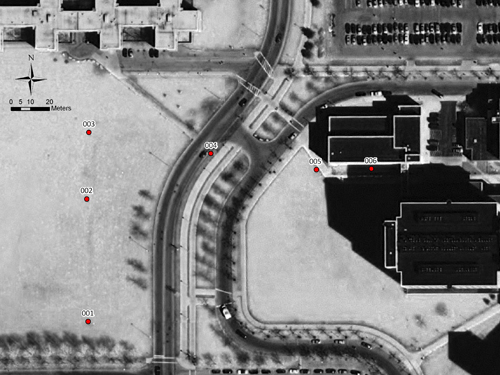
Differentially corrected GPS points collected near the Natural Science Complex, State University of New York at Buffalo, Buffalo, NY 14260-3050. Points were collected using a Trimble 5700 GPS unit and corrected to a Trimble 5700 serving as a base station nearby. The dataset was created to look at the results / accuracy of several GPS units by serving as a standard dataset to compare the individual GPS units.

Photos

Overview of the GPS points

Data

Control Points
Shapefile containing 6 corrected GPS points and base station coordinates (8.67 KB) – Download

Control Point Photos
JPEG photos of control point locations (2.22 MB) – Download

Spectral Radiometer Data for the North Slope, Alaska

Data Description

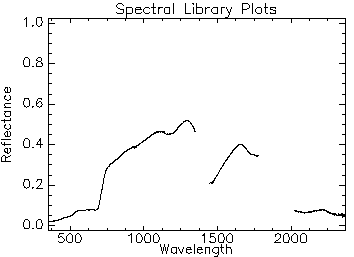
Spectral radiometer data was collected in three locations north of the Brooks Range in the area of Toolik and Galbraith Lakes, Alaska during July of 2007. Several surface cover materials were collected at each location using an ASD Field Spec Pro. and compiled into an ENVI spectral library file for use and distribution. Included in the files for download are:

  • ENVI spectral library file
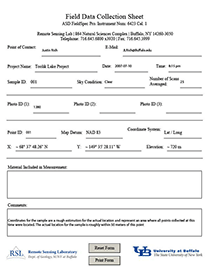
  • Metadata for each sample collected

People

  • Justin L. Rich
  • Dr. Beata Csatho

Data Example

NorthSlope_Data
NorthSlope_Metadata

Preferred Citation

Rich, J. L. and Trochim, E. (2007) AMS Spectrometer data: North Slope Alaska. Instrument 6423, Cal. 1


Data

Spectral Library
ENVI 4.3 Spectral Library File (229 KB) – Download

Metadata
PDF and JPEG Files (37.3 MB)Download