

Summer 2026: extreme heat waves sweep across Europe, breaking longstanding records in many countries. Does personally experiencing such heat waves change people’s climate attitudes or even their policy preferences? Our research indicates this is not the case. But more broadly, it emphasizes the stumbling blocks when trying to make an evidence-based claim on this question in the first place.
Why? Because to measure the effect of extreme weather, researchers first have to define it. Our study shows this seemingly technical step involves challenges – which have implications that go far beyond research investigating the consequences of weather.
Nature’s experiments come with fine print
Social scientists love so-called natural experiments. Researchers cannot randomly assign who gets exposed to heat waves, floods, refugee arrivals, or economic hardship. If this were possible, it would help tremendously in credibly tracing the consequences of such exposure, however. This is why researchers use instances of naturally occurring random chance that expose some, but spare others. Comparisons from such “experiments by nature” then promise to reveal the impacts these events have on society.
Yet, nature does not hand over a tidy dataset. Before any analysis, researchers must translate a messy real-world event into numbers. They must decide what exactly counts as “exposure.” That decision looks technical and innocent. It is neither.
So what exactly is “extreme” weather?
Extreme weather illustrates this challenge well. Is a day extreme when the thermometer passes 30°C? Or when it is unusually hot for that place and that time of year? Unusual compared to the past 10 years, or the past 25? Among the hottest 5% of days, or the hottest 10%? And should we look at heat at all – or at drought, rain, or floods?
Screening the published literature, we counted at least 280 plausible ways to measure extreme weather. Even authorities disagree: the Intergovernmental Panel on Climate Change (IPCC) and the Swiss Federal Office of Meteorology and Climatology (MeteoSwiss) define extreme weather based on different criteria. Below, we compare their two definitions for how strongly citizens in Switzerland experienced extreme heat in 2018–2019. The two maps show the percentage of days with extreme temperature experienced by our survey respondents across the country. The definitions give very different answers — note the diverging scales — both overall and in how extreme heat is spread across the country. So which is the correct measure for answering our question?
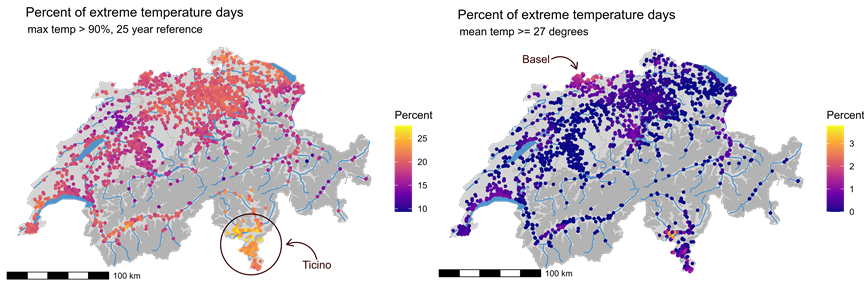
Differences between operationalizations of extreme weather based on definitions by the IPCC (left) and MeteoSwiss (right). Each dot is one respondent taking part in both survey waves (2018 and 2019). Coloring indicates the percentage of extreme days experienced between the two waves, from dark blue (few) to yellow (many); note the different scales of the two maps. Dark grey areas mark uninhabited parts of Switzerland.
The same ambiguity haunts other natural experiments. When does the arrival of immigrants count as noticeable exposure? When does a swing in crop prices lead to economic hardship? Researchers studying these questions likewise use many different operationalizations. And often, published studies do not explain why they picked their particular definition — and readers rarely see the roads not taken. Statisticians call this a garden of forking paths: many small, invisible choices, each of which can change where you end up.
One question, 34 answers
To show what is at stake, we linked a survey panel of almost 3,000 Swiss residents – interviewed at the beginning of 2018 and the end of 2019, a period which includes two record-breaking summers – to daily weather data at their home address. We then picked 34 plausible ways of operationalizing extreme weather, all used in prior applied research. To find out whether extreme weather actually affects respondents’ preferences for stricter climate policies, we then ran the identical analysis 34 times, once for each of the different ways of measuring.
The figure below shows all 34 results. Three find statistically significant – meaning unlikely to be pure chance – albeit small effects. But they disagree: two suggest extreme weather increased support for stricter climate policy, one suggests it reduced it. The remaining 31 find no significant effect. Notably, the two definitions plotted above by the IPCC and the Swiss Federal Office of Meteorology and Climatology lead to different conclusions.
Figure: The same analysis run with 34 established definitions of “extreme weather.” Each dot is one estimated effect on climate policy preferences; bars show statistical uncertainty. Most estimates cluster around zero.
A researcher who picks just one definition – in many cases driven by data availability – could therefore report a positive, a negative, or a null effect from the same people, the same place, and the same period. Viewed as a whole, however, the evidence is clear: even two historic heat waves left Swiss climate policy preferences essentially unchanged. Digging deeper, we find the chain breaks at the first link—those who were more exposed did not perceive the weather as more extreme than those who were less exposed.
Why this matters beyond the seminar room
Our results matter more broadly. First, for trust in science: published studies overwhelmingly report that experiencing extreme weather raises climate concern, while negative findings are almost absent. Given that our 34 estimates scatter across positive, negative, and null, this imbalance could be a sign of publication bias: studies finding the expected result are more likely to be submitted to journals – and to get accepted for publication. Making measurement decisions more transparent could help journals accept seemingly “uninteresting” results more easily.
Second, it matters for climate politics. A popular hope is that climate change will correct itself politically: as impacts become tangible, citizens will demand action. Our findings caution against counting on this. Personal experience alone did not move opinions, even in a country that is warming at twice the global average. Not all hope is lost, however: future research could trace whether both those personally affected and those personally spared could simultaneously become more aware of, and willing to address, climate change.
Show the whole menu
For other studies that use “natural experiments,” too, the remedy is transparency, not despair. When theory cannot single out one best measurement, researchers should report results for the whole menu of plausible definitions. And when they find apparent linkages, they should also test the steps through which an effect is likely to occur — did people perceive the event, did they connect it to the underlying cause? — before claiming that the event changed minds. Our article offers a practical template and checklist for doing this.
Hence, natural experiments remain a powerful tool for identifying cause and effect in the social sciences, but their credibility depends on decisions that too often remain hidden. Only if the measurement stage is set right will we be able to bring strong evidence to competing theoretical claims.
https://www.journals.uchicago.edu/doi/10.1086/735706
By Franziska Quoß (GESIS – Leibniz Institute for the Social Sciences / ETH Zurich) and Lukas Rudolph (University of Konstanz)
Transparency notice: Claude AI and DeepL were used in preparing this blog post. The authors have reviewed and revised all AI-generated content and assume full responsibility for its accuracy.