Many of the variables social scientists care about most change over time. We typically build models to explain shifts in average levels, such as how approval ratings rise or fall in response to economic change, or how GDP grows or contracts in response to political events. Yet sometimes what matters is not the average level of a variable but how erratic it is. Imagine deeply polarized public trust in institutions, swinging from one survey to the next, or economic growth that moves between booms and busts. That instability — the volatility around the average — can itself be a substantive quantity worth studying and explaining.
Fortunately, standard tools exist for this purpose: ARCH and GARCH models, long established in time series analysis, are designed to model how variance changes over time. The mechanics of these models are well understood. The problem is interpretation; anyone who has worked with maximum likelihood estimation (MLE) will recognize why. ARCH and GARCH models — just like many other MLE applications — use mathematical transformations (called link functions) to keep certain quantities (like variance) within logical bounds. The result of these link functions is that the raw model output is difficult to interpret in any meaningful way. In the 1990s, scholars confronted this problem in MLE models and provided tools to translate opaque coefficient estimates into quantities people could use: software packages like Clarify and the margins command, and intuitive summaries like predicted probabilities. Those innovations changed how we communicate substantively meaningful empirical results.
Until now, however, no equivalent means of transformation has existed for ARCH and GARCH models. As a result, most published work using these models stops at statements about the sign and statistical significance of effects: whether a variable of interest increases or decreases volatility, and whether we can be confident that this variable matters. That is a thin foundation for substantive claims about the impact of, say, economic contraction on volatility in government approval or of political events on volatility in growth.
We offer a new suite of tools to fill this gap. Drawing on four distinct approaches to quantifying statistical uncertainty, our methods allow researchers to move well beyond sign and significance when analyzing volatility. For readers who have not estimated a GARCH model recently — or ever — we have included an extensive introduction to the approach, along with worked examples with replication code.
Our first approach bootstraps the model’s estimated parameters directly, a technique used extensively in other time series work, including work on volatility. The second resamples the model’s residuals to reconstruct plausible versions of the underlying data series, fits a new GARCH model to each, and uses the resulting distribution of estimates to characterize uncertainty. The third applies a maximum-entropy bootstrap, which is specifically designed to respect the temporal structure of time series data. The fourth — developed in the supplemental materials — applies the delta method to the model’s predicted volatility values, exploiting the fact that these are nonlinear combinations of estimated parameters.
All four approaches share a common set of outputs. Each produces an estimated level of volatility over time. Each allows a researcher to introduce a hypothetical change — a “shock” — to one of the model’s variables and observe how volatility responds. And each presents these quantities with associated measures of statistical uncertainty.
Our paper illustrates the value of our tools in two substantive examples. At the most basic level, they make volatility modeling more informative: instead of noting that a variable has a “positive” or “negative” effect, we can see precisely how much volatility is expected to rise or fall in response to a “shock” to a covariate. More importantly, we demonstrate something that applied researchers already know from working with other MLE models: that the substantive meaning of any variable’s effect depends on the values of the other variables in the model. If we are indeed serious about taking variance seriously, then interpretation that accounts for the full model context is not optional; it is essential.
For instance, in our replication of Hellwig (2007), we revisit the question of whether shocks to trade exposure in the UK have meaningful effects on the volatility of support for the prime minister. We find a statistically significant, positive effect ( β= 0.058, p = 0.09) of an increase in trade exposure on volatility. Prior to our work, this is where meaningful interpretation of the model would have stopped. But our approaches give researchers a means to draw additional, meaningful substantive inferences. Using the parametric boostrapping approach, we can draw β sets of boostrapped model parameters and trace the effect of a shock to trade exposure on the volatility, constructing confidence intervals using the β parameter sets.
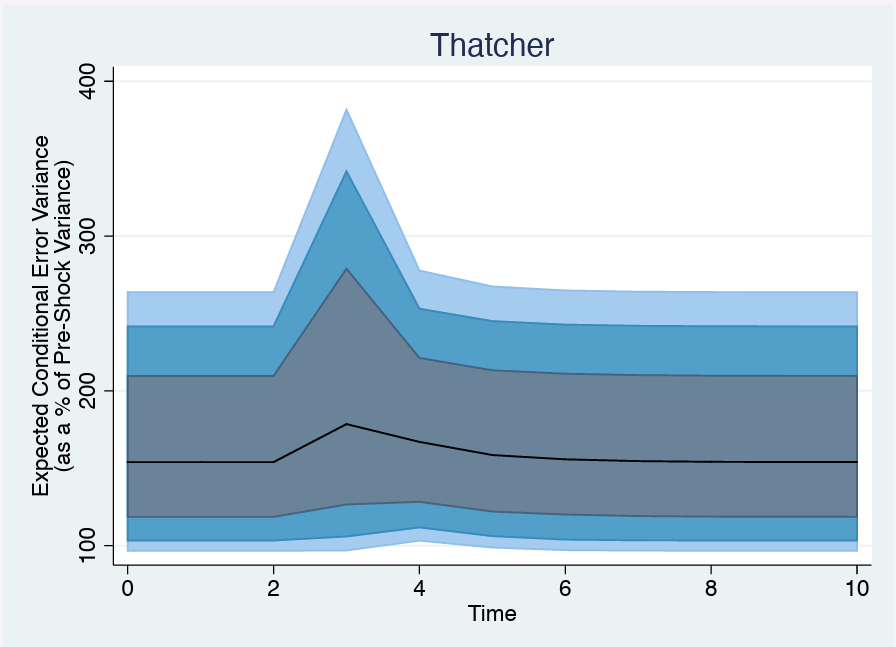
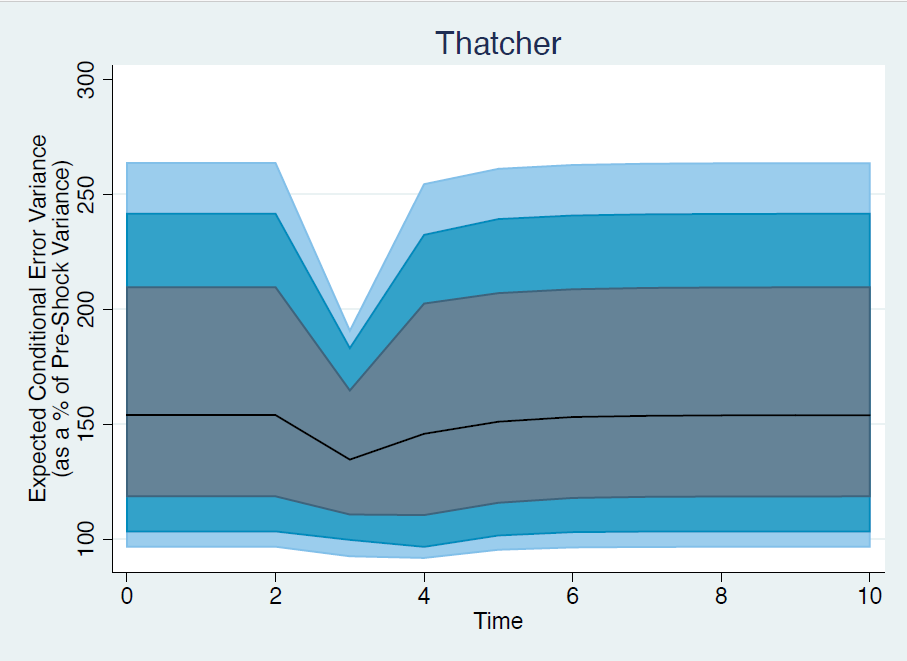
On the left, we show the simulated effect of a four-unit positive shock to trade exposure; on the right, a four-unit negative shock to trade exposure. Both demonstrate a common theme: the substantive effect of this shock is marginal, at best. The expected error variance of government support only increases by about 20\% of the pre-shock variance. As mentioned, this inference was obscured by simply looking at parameter estimates, as the exponential link function of the (G)ARCH model makes the coefficient not directly interpretable.
These approaches, though, are only as useful as they are practical to implement. We follow the example of earlier methodological scholars who not only introduced ideas but also developed helpful code for practitioners to use to implement those ideas. Scholars of volatility (or those who want to become scholars of volatility) should keep a peeled eyeball for forthcoming Stata commands gbmake and gbplot. With these, all you have to do is conceive and estimate your ARCH or GARCH model. From there, specify a predictor of interest, and conceptualize a counterfactual shock, and the software will do the rest.
We designed these tools to be easy to implement. Once a researcher has estimated an ARCH or GARCH model, our forthcoming Stata commands, gbmake and gbplot, automate the process of generating simulated volatility trajectories, uncertainty intervals, and graphical displays of substantive effects. Researchers can specify counterfactual shocks to variables of interest and evaluate how volatility responds over time under different scenarios.
The software implements all of the approaches described in our article, allowing users to move beyond coefficient tables and toward substantively meaningful interpretations of volatility dynamics. Replication materials and examples will accompany the public release of the commands.
To summarize: volatility is of theoretical interest, but methodological limitations have kept scholars from exploring substantive inferences from statistical models of volatility. We introduce a framework for making those inferences, and soon we will release software that greatly simplifies the implementation of our framework.
https://www.journals.uchicago.edu/doi/epdf/10.1086/734275
Allyson L. Benton, University of Essex
Soren Jordan, Auburn University
Andrew Q. Philips, University of Colorado Boulder